Seasonality
How to Read TradingView Seasonality: Charts and Historical Performance
Many people see that an asset did well in a certain month historically and instinctively think: if this month has often risen in recent years, is it more likely to rise again this year?
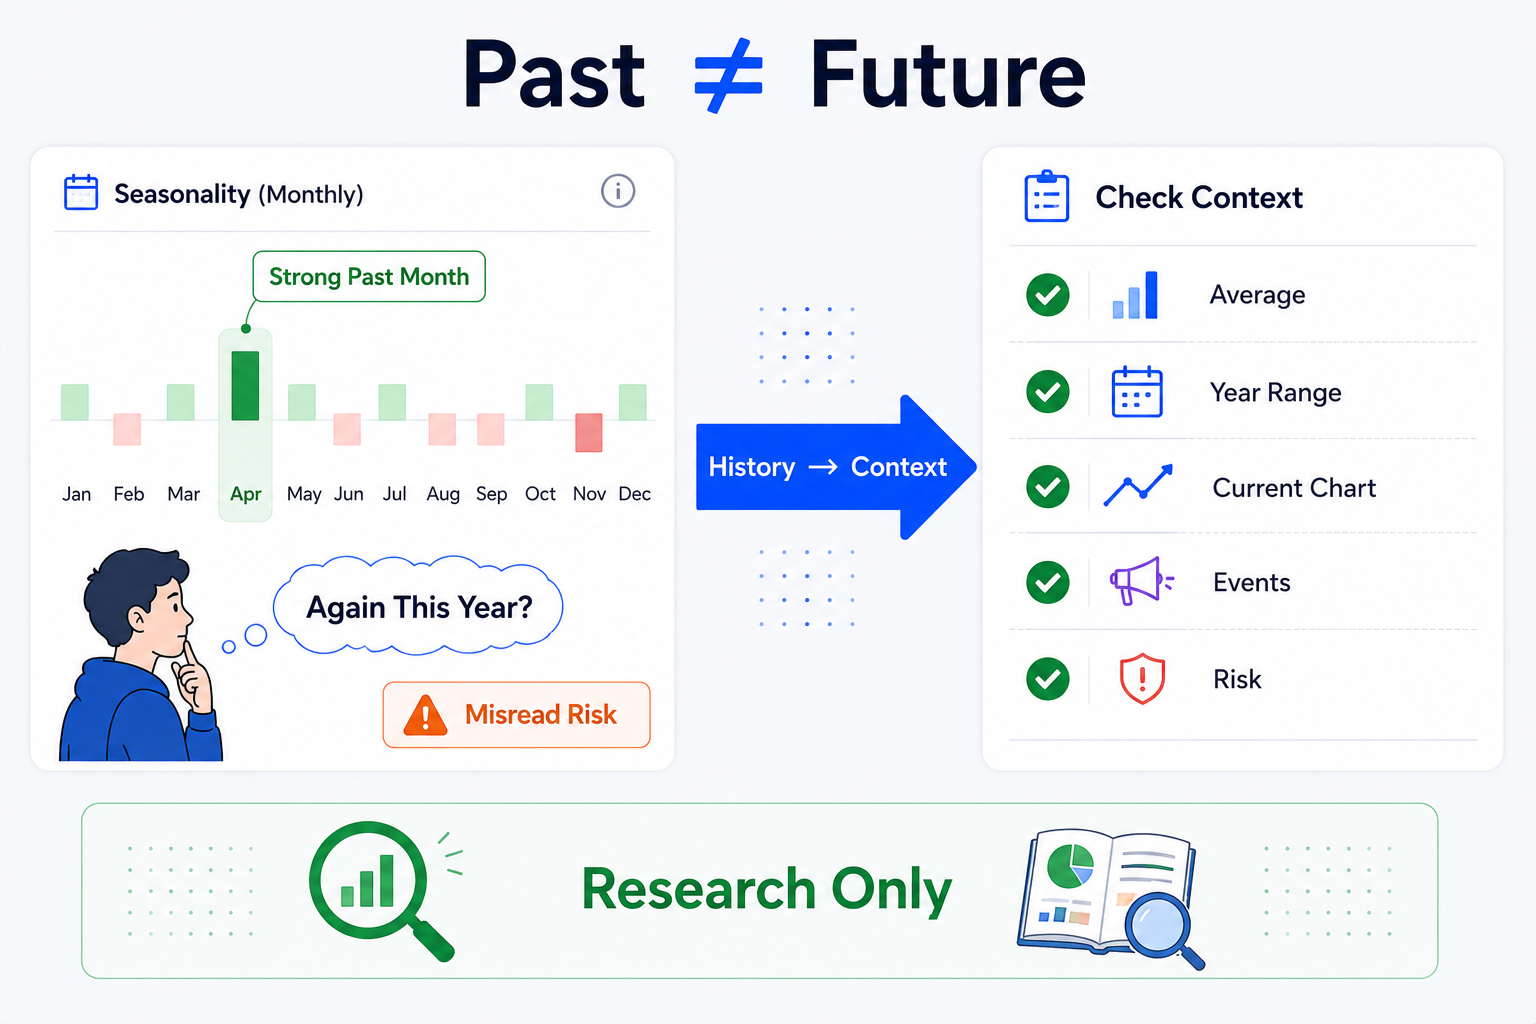
That is where TradingView Seasonality most often misleads beginners. Seasonal charts can look like they are telling you “which months are stronger and which are weaker,” but markets are not obliged to keep doing what they often did before.
Something that happened often in the past does not mean it must happen this time.
Seasonality’s value is giving you one more historical lens—not handing you a trading answer.
Bottom line first: seasonality is historical statistics, not a forecast
TradingView Seasonality helps you observe how an asset has tended to perform across different months, quarters, or years in history.
It is useful for questions like:
- Which months have been relatively stronger for this asset in the past?
- Which months have historically shown more volatility?
- Has the same month been consistent across recent years?
- Does the average historical path resemble recent years?
- Has a given quarter often shown unusual behavior?
- Is the current year’s path diverging from the historical average?
But it cannot directly tell you:
- That a given month will definitely rise this year;
- That a historically strong month is worth buying now;
- That a historically weak month must be avoided;
- That the average historical line will repeat this year;
- That seasonal results can replace chart analysis and risk control.
Seasonality misleads most when it looks like a rule.
But a sense of “pattern” in financial markets is often interrupted by new macro policy, earnings events, rate changes, capital flows, industry shifts, or breaking news.
So the first thing a beginner should say when opening Seasonality is:
This is a historical performance summary—not a promise about future price action.
What is TradingView Seasonality?
TradingView Seasonality can be understood as a chart tool that organizes historical performance by calendar time. If you already have an asset’s chart open on the TradingView website, Seasonality is usually a supplementary view in the same analysis environment, letting you review historical samples from a calendar angle.
A standard candlestick chart typically answers:
How did price move in chronological order?
Seasonality leans toward answering:
Over many years, did the same month, quarter, or time window show any repeating tendency?
A simple example:
On a daily chart for an asset, you might see 2021, 2022, 2023, 2024, and 2025 connected in time order.
A seasonal chart may instead compare the same month across different years so you can observe:
- How January has performed on average historically;
- Whether September has often been weaker in recent years;
- Whether a given quarter has tended to be more volatile;
- Whether the current year’s path is close to the past average.
Think of it as a chart from a “historical calendar” perspective.
It is not saying “this year will copy the past.” It is reminding you:
in this time window before, the market behaved in certain ways.
How is Seasonality different from a standard price chart?
Many beginners feel disoriented the first time they open a seasonal chart, because it does not show price continuously over time the way candlesticks do.
You can distinguish them like this:
| Tool | Main way to read it | Better questions to ask |
|---|---|---|
| Standard candlestick chart | Follow real chronological price change | What structure is price in now? |
| Volume | Activity over time | When was trading more active? |
| Seasonality | Compare historical performance by calendar month or cycle | Which time windows stood out historically? |
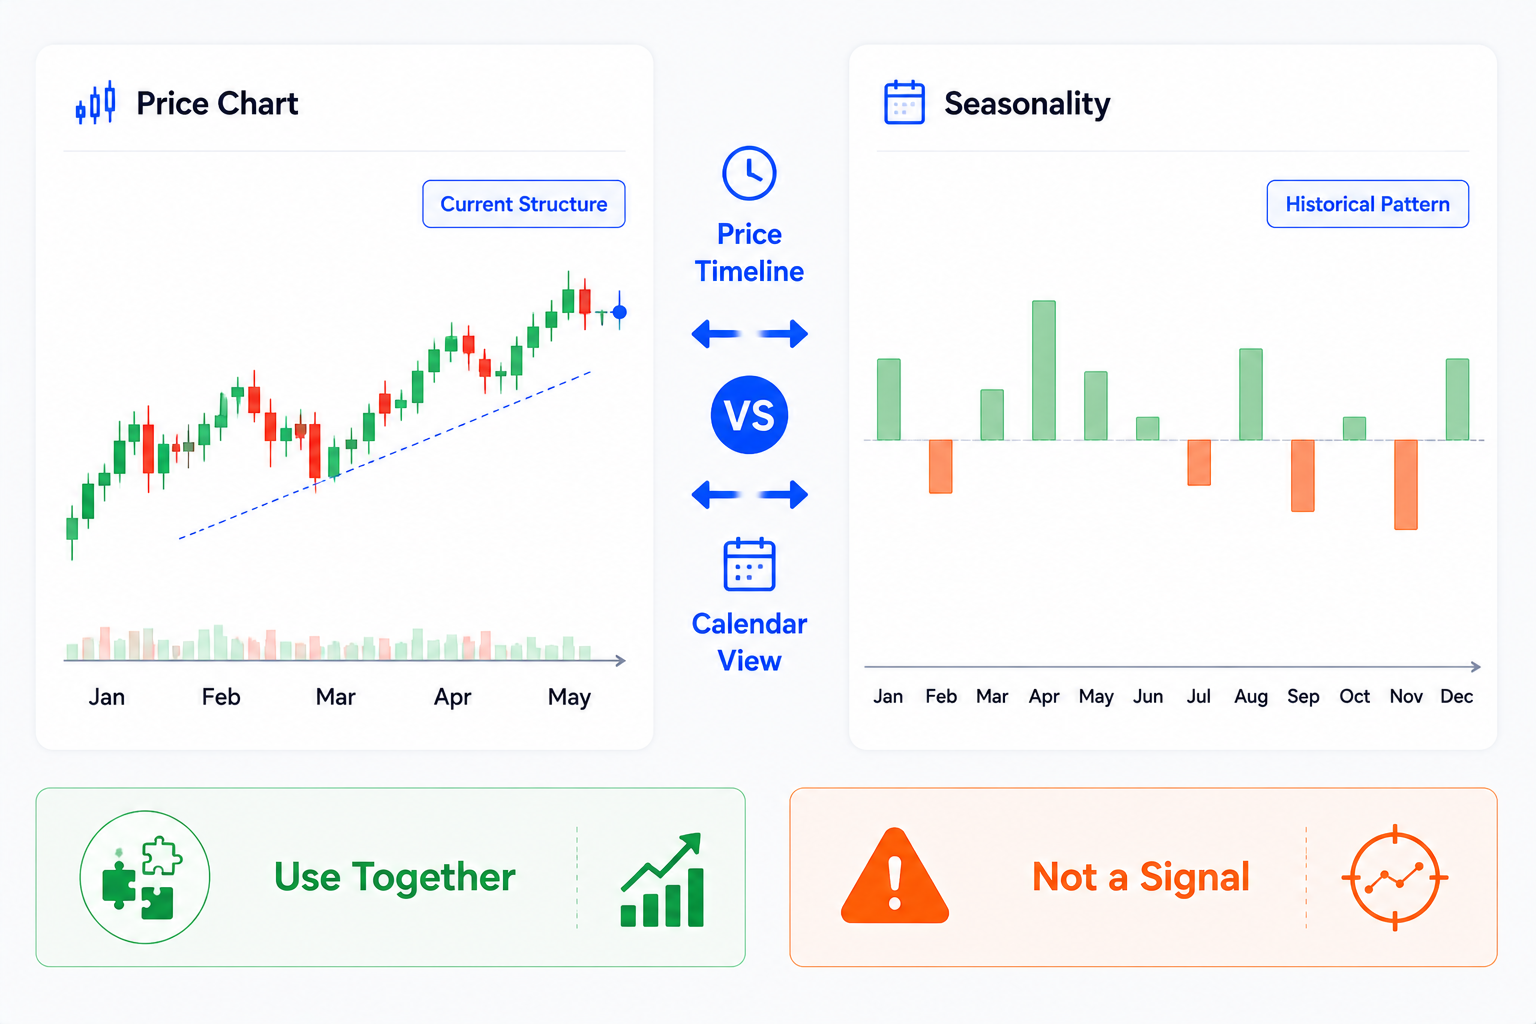
Standard charts focus on “how price got here.”
Seasonality focuses on “whether similar calendar periods tended to behave a certain way in the past.”
They do not replace each other.
You should not ignore current chart structure because Seasonality shows a month with a strong historical average; nor should you ignore an upcoming seasonal or event backdrop because the current chart looks good.
A safer approach:
Use standard charts for current structure; use Seasonality for historical time context.
What is TradingView Seasonality good for observing?
1. Historical monthly performance
This is the most intuitive use.
You can check whether an asset’s performance across months in the past shows clear differences.
For example:
- Over the past 10 years, has April often been relatively strong for this asset?
- Has September often been more volatile in recent years?
- Have some months produced extreme outcomes?
- Is the current month close to its historical average?
But the key point is:
reviewing monthly performance is not predicting this month’s result.
If December has averaged well historically, that only means December showed a tendency in the past sample. It does not prove December will repeat this year.
2. Quarterly performance
Some assets are easier to read by quarter.
For example:
- Does Q1 often see capital reallocation?
- Are earnings seasons concentrated in certain phases?
- Do some industries have clear peak or off seasons?
- Are commodities affected by seasonal demand shifts?
- Do some indices show more volatility in specific quarters?
The quarterly view is wider and suits medium-term historical performance.
But you still cannot turn quarterly history into a formula:
Q4 often rose in the past, so Q4 must rise this year.
That conclusion is too crude and easy to write without today’s market context.
3. Average historical path
One common element in Seasonality is an average historical performance curve.
It averages many years of data into a line that represents the “average historical path.”
That line easily misleads beginners:
Since the average line goes like this, will price follow it this year?
That is not the right reading.
The value of an average historical line is showing the overall tendency in a past sample.
But averages hide a lot of variation.
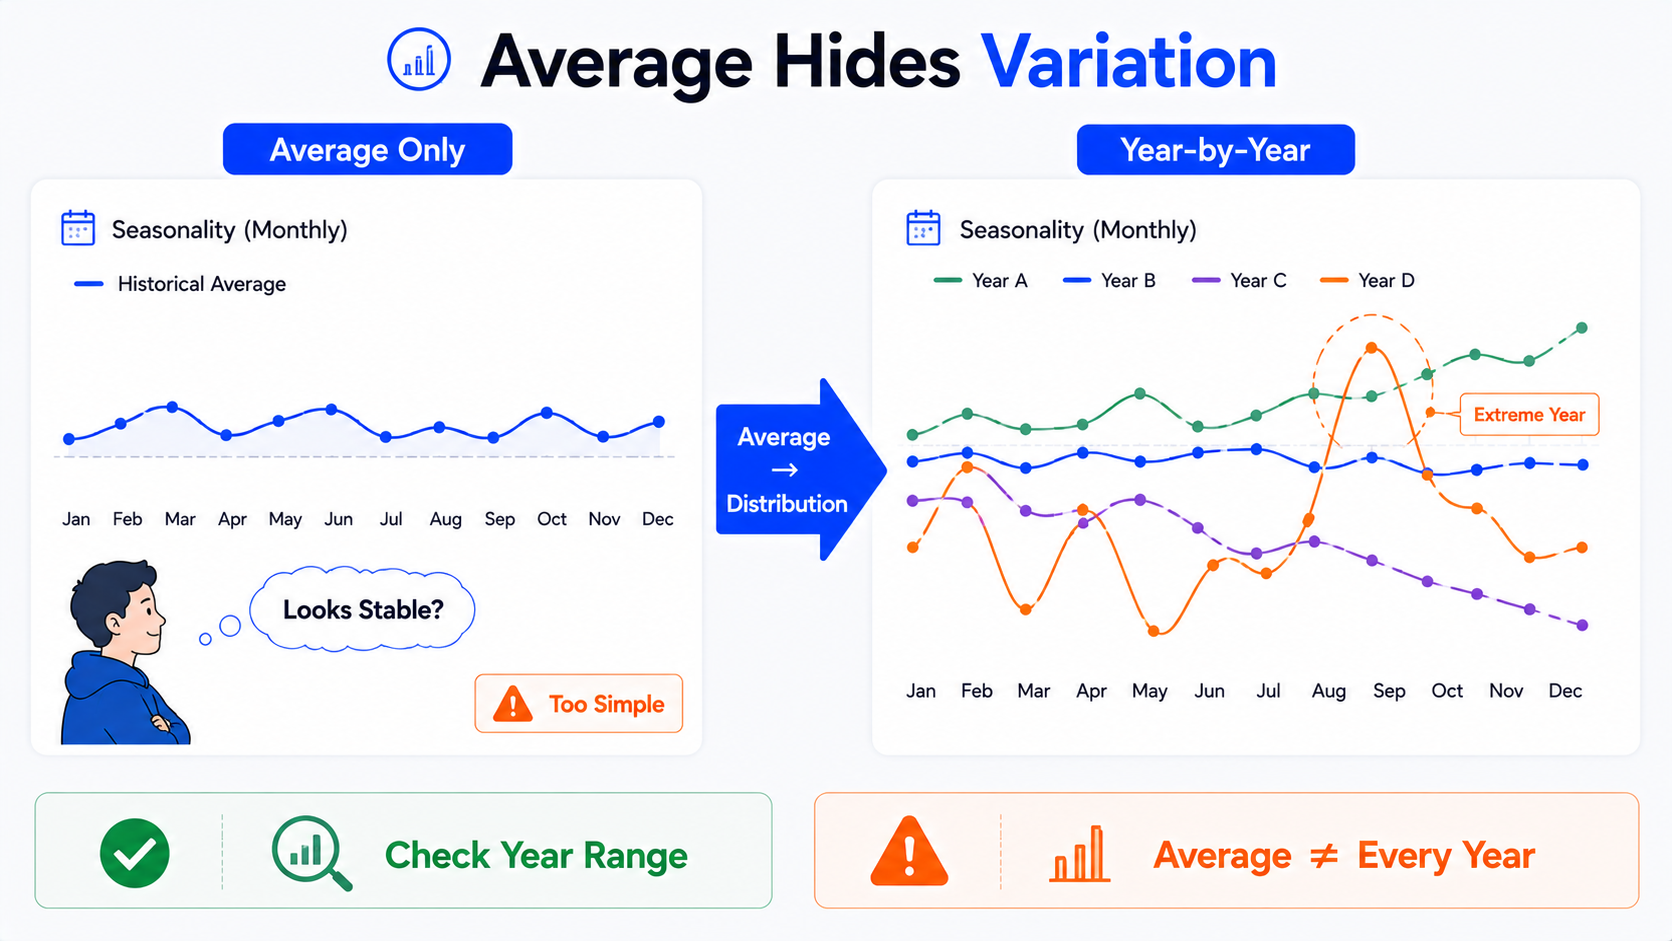
For example, a month averaging +2% might come from:
- Most years rising modestly;
- A few big up years and many flat ones;
- Some big up years and some big down years, averaging out to something that looks fine.
When you read an average line, always look at year-by-year differences too.
4. Year-by-year differences
Year-by-year differences are one of the most valuable parts of Seasonality for beginners.
If you only look at the average, you may think historical performance was very stable.
Expand each year and you may find:
- Some years clearly diverged from the average;
- Some months were very inconsistent;
- Extreme years heavily influenced the average;
- Recent years differ from earlier ones;
- The current market environment already differs from the historical sample.
That helps you avoid treating the “historical average” as a “future roadmap.”
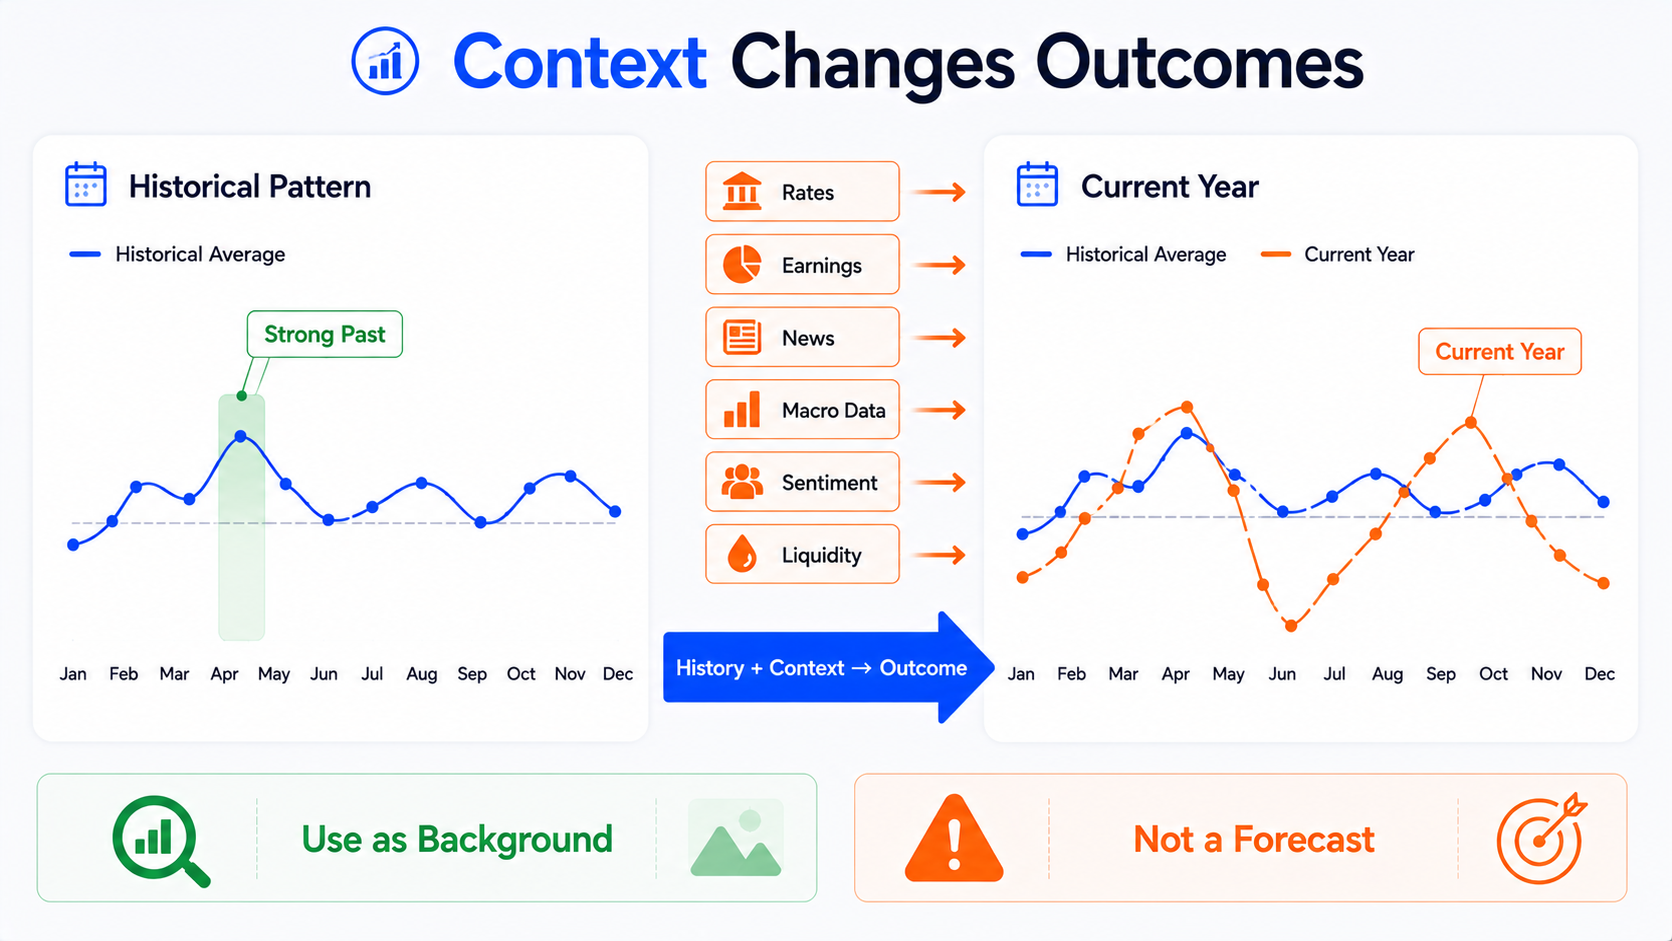
5. Current year vs historical average
When Seasonality compares the current year’s path with the historical average, beginners can observe:
- Whether the current path is close to the historical average;
- Whether this year clearly diverges from past tendencies;
- Whether the divergence ties to specific events;
- Whether the current month is already in a state unlike history.
That is still review and context—not prediction.
If this year has already diverged sharply from the average, you cannot simply say “it must revert to the average next.” Markets are not obliged to return to that historical line.
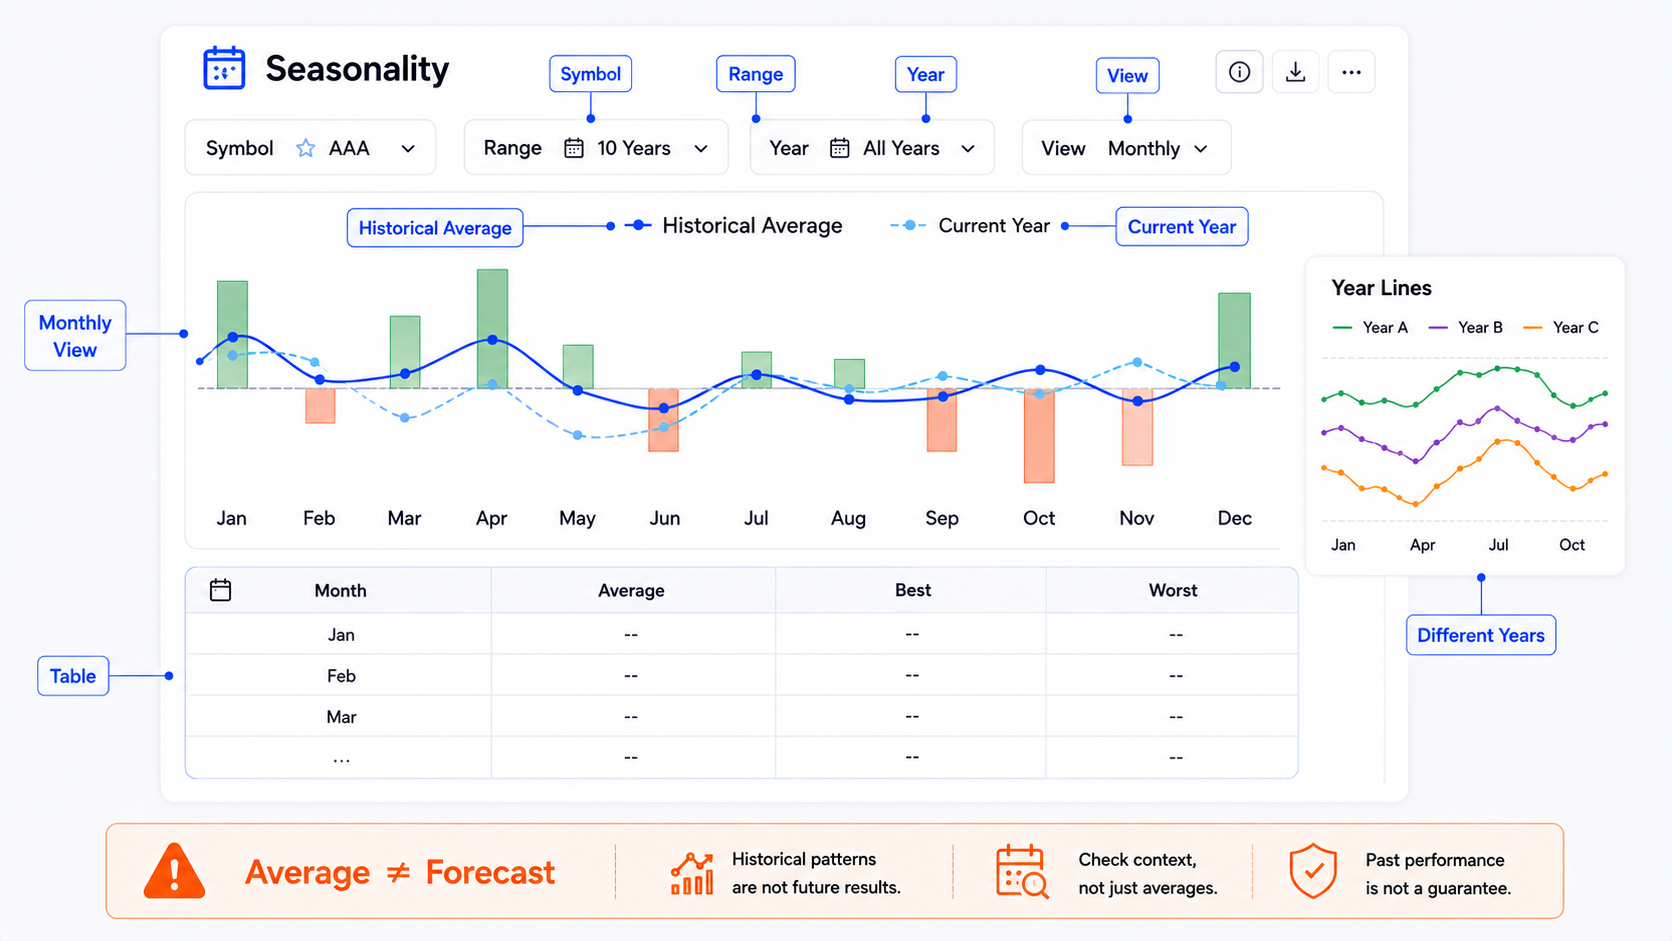
Common information dimensions in seasonal charts
Seasonality pages usually organize months, quarters, years, historical averages, and the current year in one view so you can cross-read from several angles.
Month dimension
The month dimension is usually for January through December in a year.
You can focus on:
- Which months averaged stronger performance;
- Which months were historically weaker;
- Which months showed more volatility;
- Whether the current month aligns with historical tendency.
Good for beginners because months are the most intuitive.
Quarter dimension
The quarter dimension suits wider windows such as Q1, Q2, Q3, and Q4.
Especially useful if you are looking at:
- Indices;
- Sector ETFs;
- Commodities;
- Assets with clear seasonal demand;
- Markets where earnings seasons or policy cycles stand out.
A quarterly view may fit better than a single month.
Year dimension
The year dimension helps compare performance across years.
For example:
- Have the last 3 years differed from the past 10?
- Did extreme years skew the average?
- Is the current year clearly off the historical average?
- Is seasonal tendency fading over time?
That reminds you: historical samples are not monolithic.
Historical average
Average historical performance is the easiest to read—and the easiest to misread.
It helps you quickly see overall tendency, but should not be used alone.
Looking only at the average ignores sample distribution, extreme years, and differences in today’s environment.
Current year comparison
Current-year comparison lets you see whether today’s performance is close to the historical path.
But do not write it as:
This year is below the average, so it must catch up.
This year is above the average, so it must pull back.
That turns statistical context into a price promise.
What beginners misunderstand most often
Myth 1: Only looking at the average
The average is the easiest—and the riskiest.
If you see a positive historical average for a month and decide that month is better for trading, you ignore two problems:
First, a few extreme years may have lifted the average.
Second, this year’s environment may be nothing like the historical sample.
A more reasonable approach:
Look at the average and at each year’s differences.
Myth 2: Ignoring extreme years
Some years produce unusual performance because of special events, such as:
- Financial crises;
- Pandemic shocks;
- Sharp rate moves;
- War or geopolitical events;
- Major company events;
- Sudden policy shifts;
- Supply–demand shocks in commodities.
Those years affect historical statistics.
If you ignore extreme years and only look at a smoothed average line, history can look more stable than it really was.
Myth 3: Ignoring the current market environment
Seasonal statistics come from history, but you are facing the market today.
Today’s environment may include:
- Rate cycles;
- Inflation pressure;
- Earnings season;
- Central bank policy;
- Industry fundamentals shifting;
- Liquidity changes;
- Extreme sentiment;
- Geopolitical risk.
Those factors can make this year completely unlike the historical average.
Myth 4: Treating historical probability as a trade signal
Even if a month rose more often in history, that does not mean it should rise this year.
The reason is simple:
Historical samples tell you what happened before; they do not guarantee the next outcome.
You can say:
This month has been relatively strong historically and is worth watching further.
But you should not say:
This month has a high historical win rate, so I should trade it now.
Myth 5: Only finding seasonal evidence that fits your view
This is a common psychological trap.
If you already want to be bullish, you may hunt for months with strong historical performance;
if you already want to be bearish, you may hunt for weak historical windows.
That is not research—it is looking for reasons to support what you already believe.
A better approach is to ask at the same time:
- Is historical performance stable?
- Are there counterexample years?
- Is the current environment different?
- Does the standard chart support this observation?
- Could events change this year’s outcome?
A sensible workflow for using Seasonality
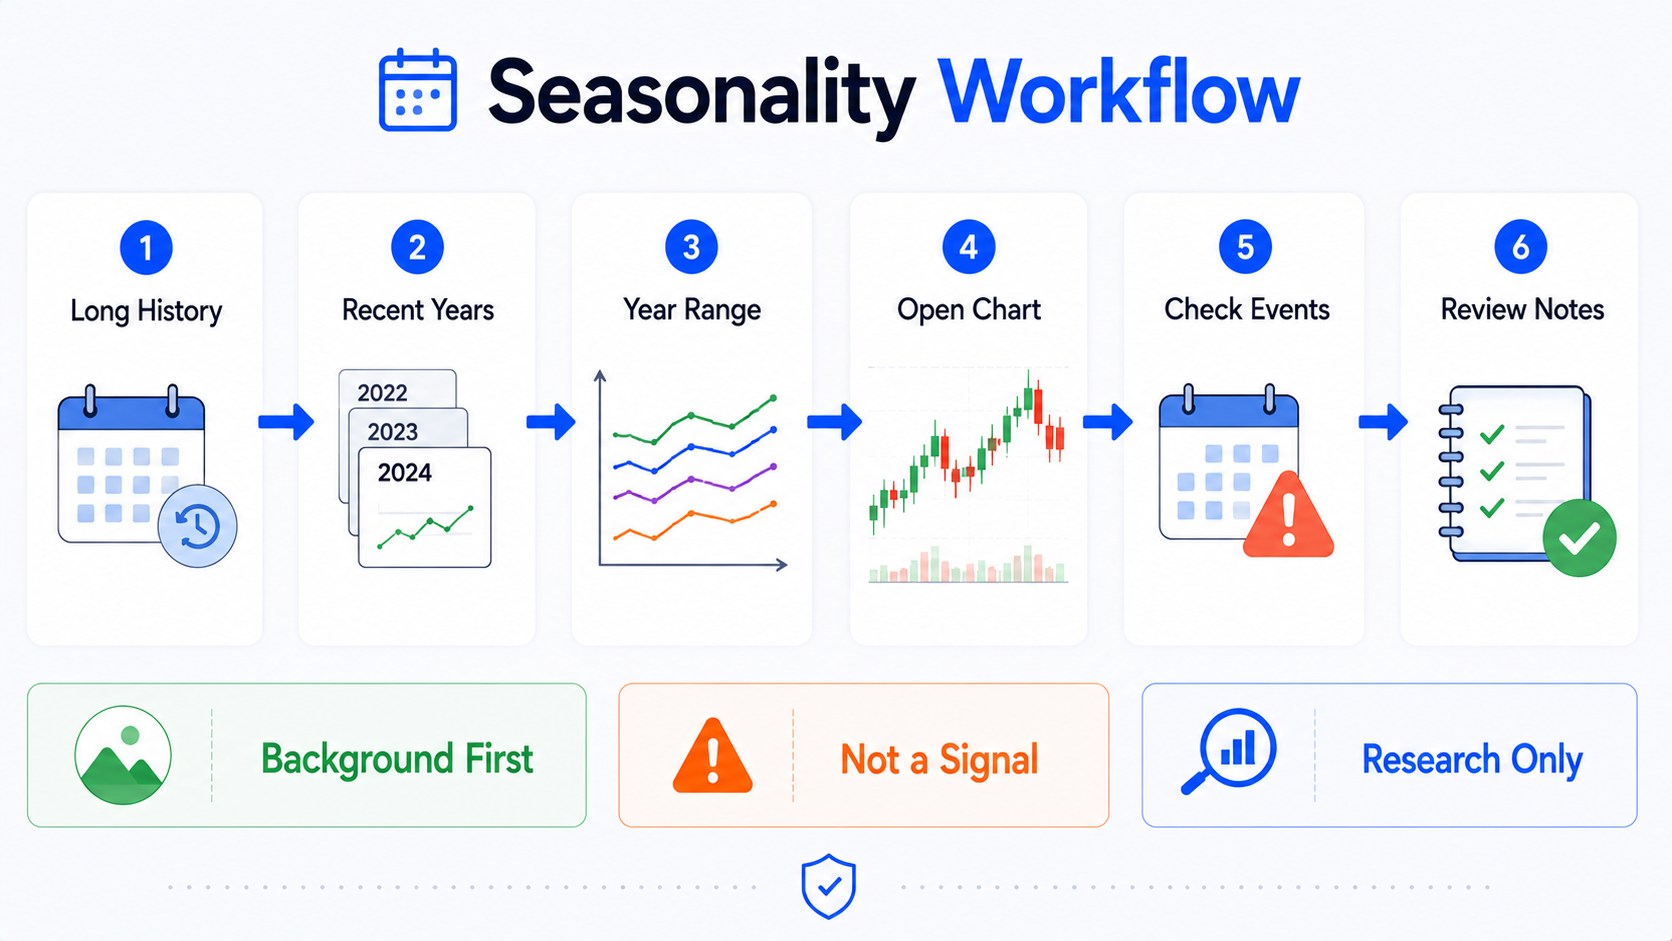
Step 1: Start with long historical performance
Do not rush to this year first.
Start with a longer sample to understand:
- Which months averaged stronger;
- Which months varied more;
- Which windows had more extreme years;
- Whether any seasonal tendency looks relatively stable.
The goal here is not answers—it is background.
Step 2: Check whether recent years still look similar
Some tendencies were clear early on but have faded recently; some assets changed market structure so seasonality is no longer as clean as before.
Compare:
- Full historical sample;
- Last 5 years;
- Last 3 years;
- Current year.
If the long average and recent years diverge a lot, be cautious.
Step 3: Return to the standard chart for current structure
Seasonality does not replace candlestick charts.
Go back to the standard chart and review:
- Current trend;
- Key levels or zones;
- Volume;
- Whether volatility is expanding;
- Proximity to prior highs or lows;
- Whether price has already diverged clearly from the average historical path.
Step 4: Check news, earnings, or the economic calendar
If you are looking at stocks, check:
- Earnings dates;
- Dividends and splits;
- Company news;
- Industry events.
If you are looking at indices, FX, or commodities, check:
- Economic calendar;
- Rate decisions;
- Inflation data;
- Inventory data;
- Policy or geopolitical events.
Seasonality is only one part of the backdrop; events can change this year’s outcome.
Step 5: Write observation notes, not trade conclusions
You might record something like:
Subject:
Time window reviewed:
Average historical performance:
Consistency in recent years:
Extreme years present:
Current chart structure:
Recent events:
My observation:
Reminder: seasonality is background only—not a basis for buying or selling.
Notes like that are more useful than “this month rose historically, so I’m bullish.”
Who is Seasonality for—and who is it not for?
| User type | Good fit for Seasonality? | Why |
|---|---|---|
| Beginners who want one more historical lens | Yes | Helps understand how some months or quarters behaved in the past |
| Users who keep review journals | Yes | Lets you compare current price action with historical averages |
| People studying indices, commodities, or seasonal-demand assets | Yes | Some assets show clearer calendar effects |
| Anyone looking for a buy/sell signal | No | Seasonality is not a direct trading tool |
| Anyone unwilling to check current charts and events | No | Historical statistics cannot replace real-world context |
| Anyone who treats averages as fixed rules | No | Seasonality is easiest to over-interpret |
If you treat it as background, it can help.
If you treat it as a prediction button, it is dangerous.
Which TradingView tools pair well with it?
1. Standard candlestick chart
Seasonality shows historical performance tendencies; standard charts show current price structure.
Together you can ask:
- Has price already diverged sharply from the average historical path?
- Does the current trend support the historical seasonal tendency?
- Does the current chart show a completely different backdrop?
2. Economic Calendar
If you follow indices, FX, bonds, or commodities, the economic calendar matters.
A month may have averaged strong historically, but if this year brings major rate decisions, inflation prints, or policy shifts in that month, real events may outweigh historical statistics.
3. Earnings Calendar
For stocks, earnings dates are critical.
A stock may have done well in a given month historically, but if important earnings or company events land in that month this year, actual price action can look very different.
4. Screener
Use the Screener to find assets you want to study, then open Seasonality to review monthly history.
Do not reverse the process—using Seasonality alone to find “historically strong” assets and jumping to conclusions.
5. Watchlist
Add assets you want to track for seasonal context to your Watchlist with notes such as:
- How this month performed historically;
- Whether the current year diverges from the average;
- Whether recent events matter;
- Whether a follow-up review is needed.
That makes Seasonality part of a research workflow—not an isolated chart.
A beginner-friendly observation workflow
Suppose you want to study an asset’s seasonal behavior. You could:
- Open the standard chart and confirm the asset and data source;
- Switch to or open the Seasonality view;
- Review average performance across past months;
- Flag months that stood out or were more volatile;
- Expand year-by-year differences;
- Check whether recent years still look similar;
- Return to the standard chart for trend and key levels;
- Review recent news, earnings, or the economic calendar;
- Write your observation notes;
- Remind yourself clearly: historical performance is not a future result.
If the average historical path looks very clean, ask one extra question:
Did most years look similar—or did a few years pull the average up?
That step prevents a lot of overly optimistic misreads.
How should you phrase seasonal observations?
If you write seasonal notes in articles, reviews, or chart comments, use cautious language.
Reasonable phrasing:
- “This month has averaged relatively strong historically and is worth watching further.”
- “In the past sample, this quarter was more volatile, but year-by-year differences were large.”
- “This year’s path has already diverged from the historical average; keep reading charts and event context.”
- “Seasonal data provides historical background—it does not mean this year must repeat.”
Avoid writing:
- “This month often rose historically, so buy.”
- “Seasonality shows it must rise.”
- “High historical win rate—opportunity confirmed.”
- “Trade by seasonality and returns improve.”
That kind of wording turns statistical context into a trading promise—bad for tutorials and easy to mislead readers.
Summary: Seasonality is background context, not a trade conclusion
TradingView Seasonality helps you observe historical performance from a calendar-time angle.
It can show you:
- Historical performance by month;
- Quarterly differences;
- Average historical paths;
- Distribution across years;
- How the current year diverges from the historical average.
It cannot tell you exactly where price goes next.
Something that happened often in the past does not mean it must happen this time.
Seasonality misleads most when it looks like a rule.
It is better at prompting a second look than at pressing the trade button for you.
A more reasonable use:
review long history, then recent-year differences, then verify on standard charts, news, earnings, or the economic calendar. Treat Seasonality as background—not as a buy/sell conclusion.
This article covers only the basics of TradingView Seasonality, seasonal charts, historical performance, and average historical performance. It does not forecast price direction, recommend specific assets, provide buy/sell advice, or promise any returns.
FAQ
What is TradingView Seasonality?
TradingView Seasonality is a seasonal chart or historical statistics tool for viewing how an asset has tended to perform across different months, quarters, or time periods. It helps you observe average historical performance and year-by-year differences, but it is not a market forecasting tool.
Can seasonal charts predict the future?
No. Seasonal charts show historical performance statistics; they do not guarantee that the future will repeat the past. Even if a month has been strong historically, this year may play out very differently because of macro policy, earnings, news events, liquidity shifts, or market sentiment.
How should you read average historical performance?
Average historical performance can help you quickly grasp the overall tendency in a past sample, but it should not be used alone. Beginners should also review year-by-year differences, extreme years, recent-year behavior, and the current market environment—so they do not mistake an average for a future roadmap.
Which tools work well alongside Seasonality?
Seasonality works well alongside standard candlestick charts, the Economic Calendar, Earnings Calendar, Screener, and Watchlist. It provides historical time context; standard charts and event calendars help you understand the current market state.
What is the biggest risk for beginners using Seasonality?
The biggest risk is treating historical patterns as trade signals. Seeing that a month performed well in the past and assuming this year will too—or seeing an average line and expecting price to follow it—is unsafe. A better approach is to use Seasonality as background context and keep researching with current charts and events.