Volume Profile · SVP
TradingView Session Volume Profile: Intraday Volume, POC, and Sessions
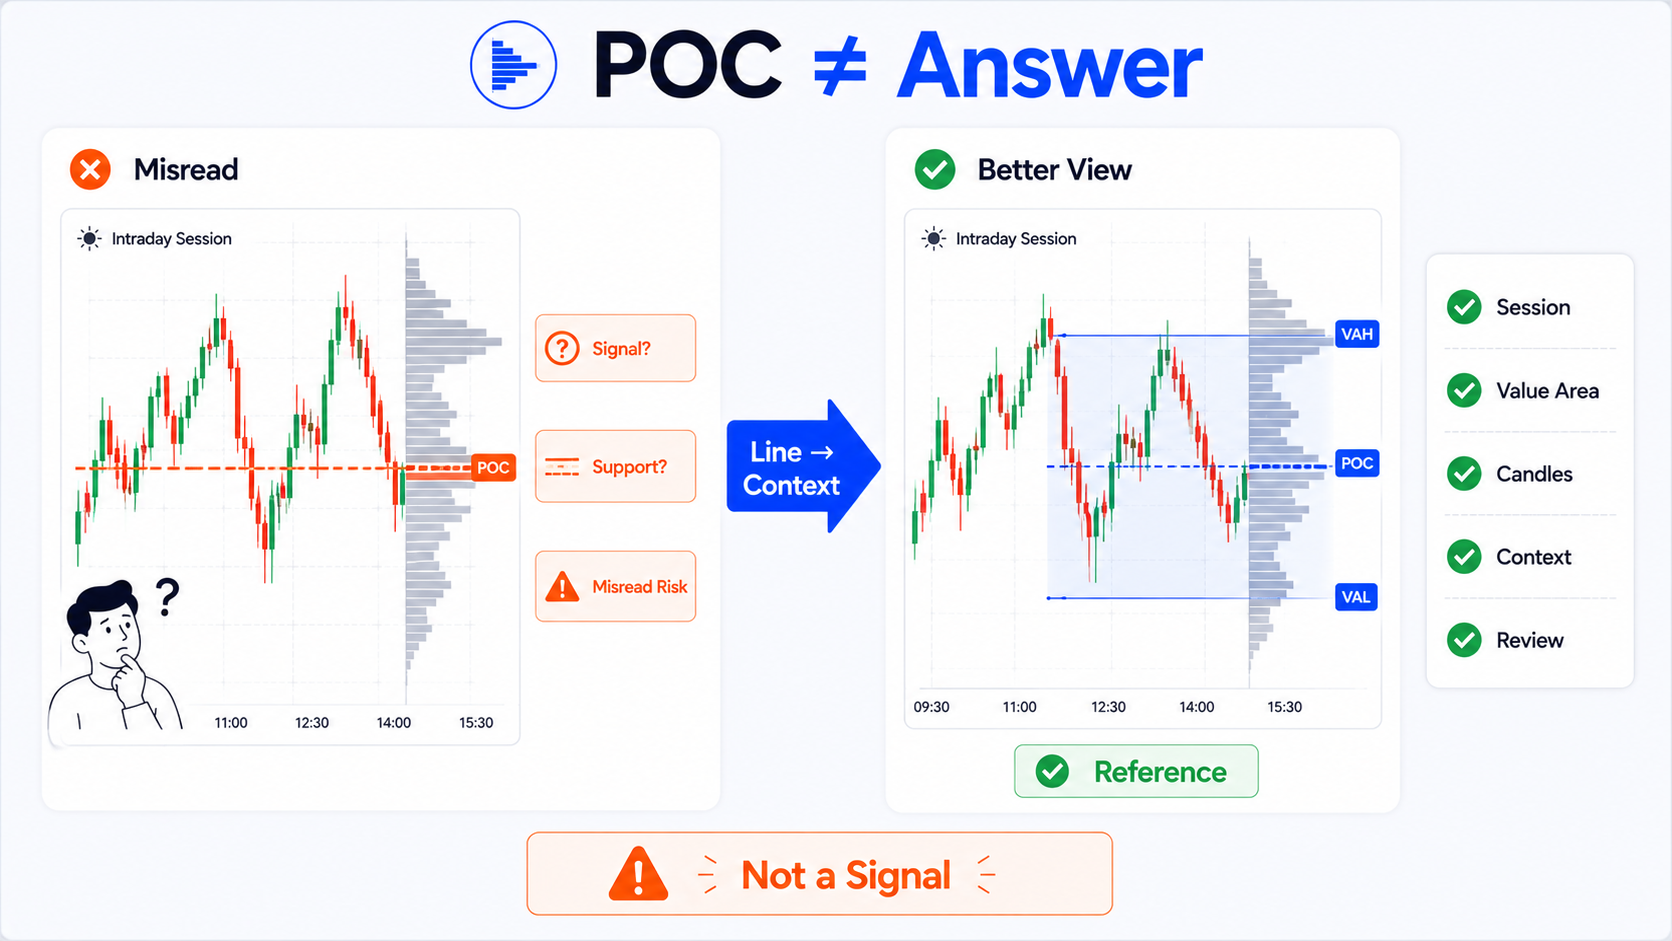
Many people add TradingView Session Volume Profile for the first time and see horizontal volume distributions beside each trading day, along with lines labeled POC, VAH, and VAL. The first instinct is often: are these precise support and resistance levels? Will price always react when it touches them?
Hold off on that interpretation.
What you need to understand first is that these lines are statistical results for a specific trading session. They help you see where volume clustered—but they cannot tell you with certainty where price will go next.
POC is not an answer the market wrote for you. It only tells you where the most volume traded in that session.
Bottom line first: SVP shows session structure, not trade signals
TradingView Session Volume Profile—SVP for short—can be thought of as a volume distribution chart grouped by trading session.
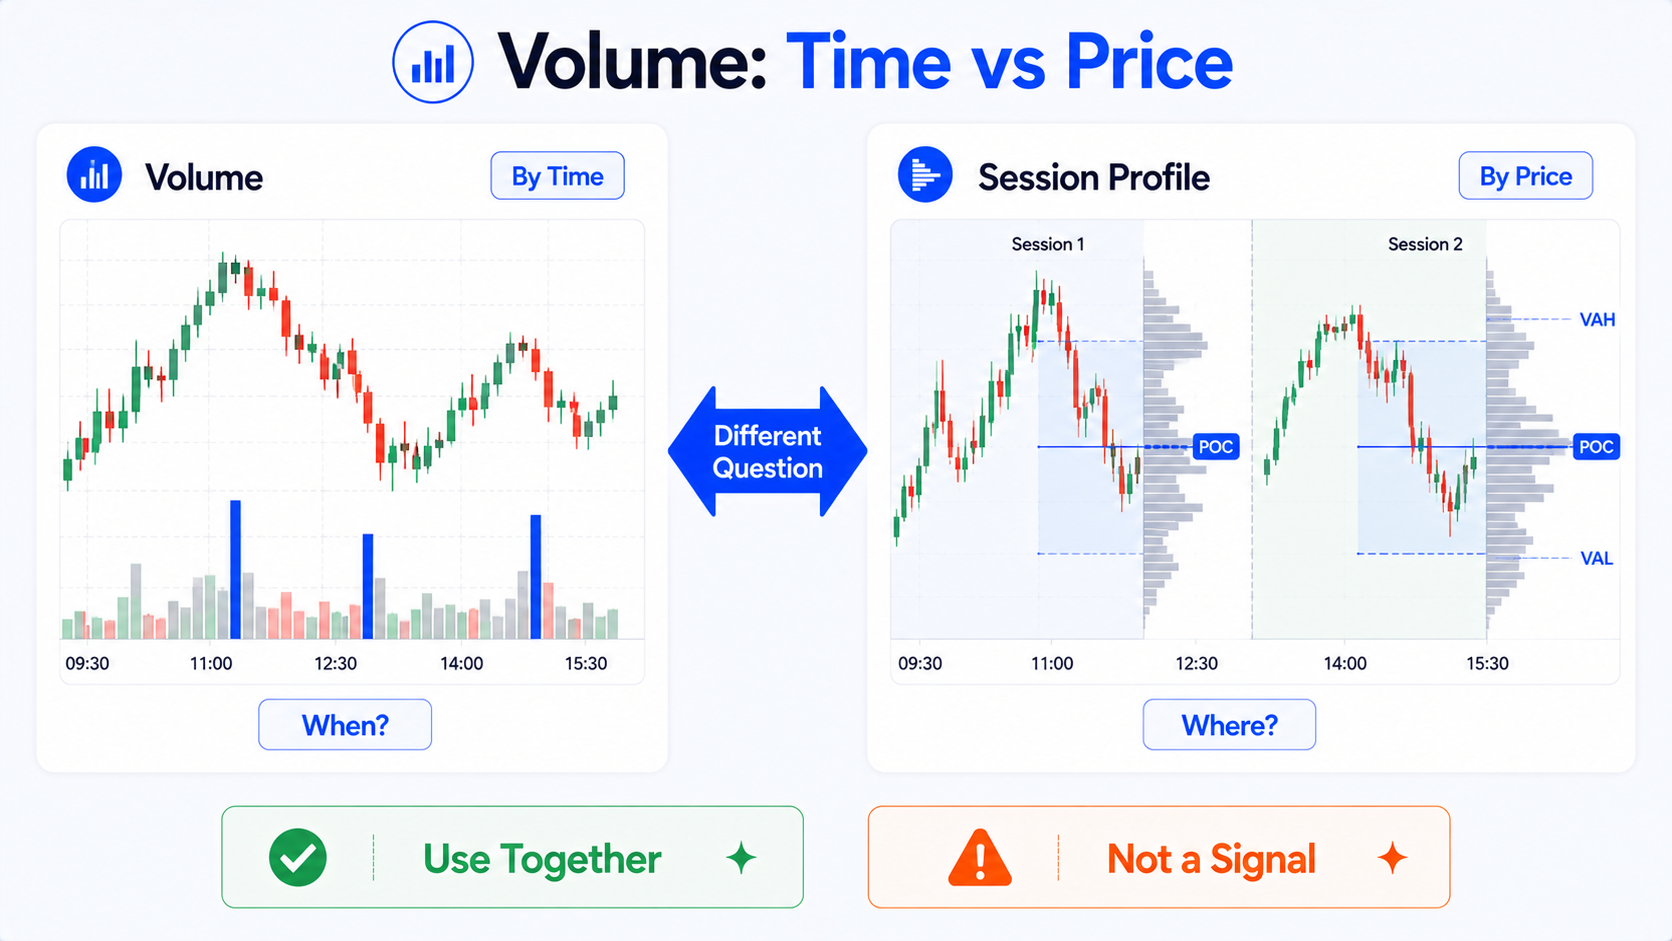
Ordinary volume bars tell you:
How much volume traded on a given candle.
Session Volume Profile cares more about:
Within a specific trading session, which price levels saw the most volume.
Those are different questions.
SVP helps you observe:
- Which price zone saw the most trading on a given day;
- Which price levels saw repeated trading during the session;
- Whether regular hours, pre-market, and after-hours volume structures differ;
- Within a range, which prices the market preferred to trade at;
- Whether POC, VAH, and VAL are useful for later review;
- Whether the volume center of gravity shifts up or down across sessions.
But it cannot directly tell you:
- POC is definitely support;
- VAH is definitely resistance;
- VAL will always bounce;
- Breaking above VAH guarantees further upside;
- Breaking below VAL guarantees further downside;
- Which level you should buy or sell at.
The most common SVP mistake is treating statistical lines like command lines.
It is an observation tool—not a signal machine.
What is Session Volume Profile?
Session Volume Profile is one type of Volume Profile.
Ordinary volume bars are read vertically:
Below each candle you see how much traded during that time window.
Volume Profile is read horizontally:
It distributes volume by price level, showing which prices saw heavy trading and which saw little within a range.
Session Volume Profile goes one step further by limiting the scope:
It calculates volume distribution separately for each trading session.
On an intraday chart, you might see a horizontal volume profile for each day:
- One profile per session on a given day;
- Another profile for the next day's session;
- Each profile has its own concentration zone;
- Each session may have its own POC, VAH, and VAL.
This is helpful for intraday review because it shows where the market mainly traded that day—not just how much total volume occurred.
How is it different from ordinary volume bars?
Many beginners already read ordinary Volume but find SVP confusing at first. Here is a simple distinction:
| Tool | Statistical angle | Main question | Best for observing |
|---|---|---|---|
| Ordinary Volume | Volume by time | Was this candle's volume large? | Volume spikes, quiet periods, active trading windows |
| Session Volume Profile | Volume by session + price level | Within this session, which prices saw the most volume? | Intraday structure, POC, value area |
| Fixed Range Volume Profile | Volume in a user-selected price range | In my chosen range, where did volume cluster? | Reviewing a trend leg, range, or pullback zone |
In short:
- Ordinary volume bars answer when volume was high;
- Volume Profile answers which prices saw the most volume;
- Session Volume Profile answers which prices saw the most volume within a given session.
If you only want to know whether a candle had unusually high volume, ordinary Volume is enough.
If you want to know where volume concentrated within a session, SVP is the better fit.
Session Volume Profile vs Fixed Range Volume Profile vs ordinary Volume
| Item | Ordinary Volume | Session Volume Profile | Fixed Range Volume Profile |
|---|---|---|---|
| How it counts | Per candle over time | Per trading session | Per user-selected range |
| Display direction | Usually vertical at the chart bottom | Horizontal along the price axis | Horizontal beside the selected range |
| Main focus | Changes in volume size | Concentrated prices within a session | Concentrated prices within a chosen leg |
| Auto session grouping | No | Yes | No |
| Good for intraday review | Can help | Very well suited | Suited to specific range review |
| Custom range | Not suited | Mainly by session | Very well suited |
| Beginner pitfall | Watching volume spikes without price context | Treating POC as absolute support/resistance | Arbitrary range selection skewing conclusions |
None of these three tools fully replaces the others.
Common combined use:
- Ordinary Volume for time-based volume spikes;
- Session Volume Profile for that day's session structure;
- Fixed Range Volume Profile for a range you define.
What is POC? Plain-language explanation
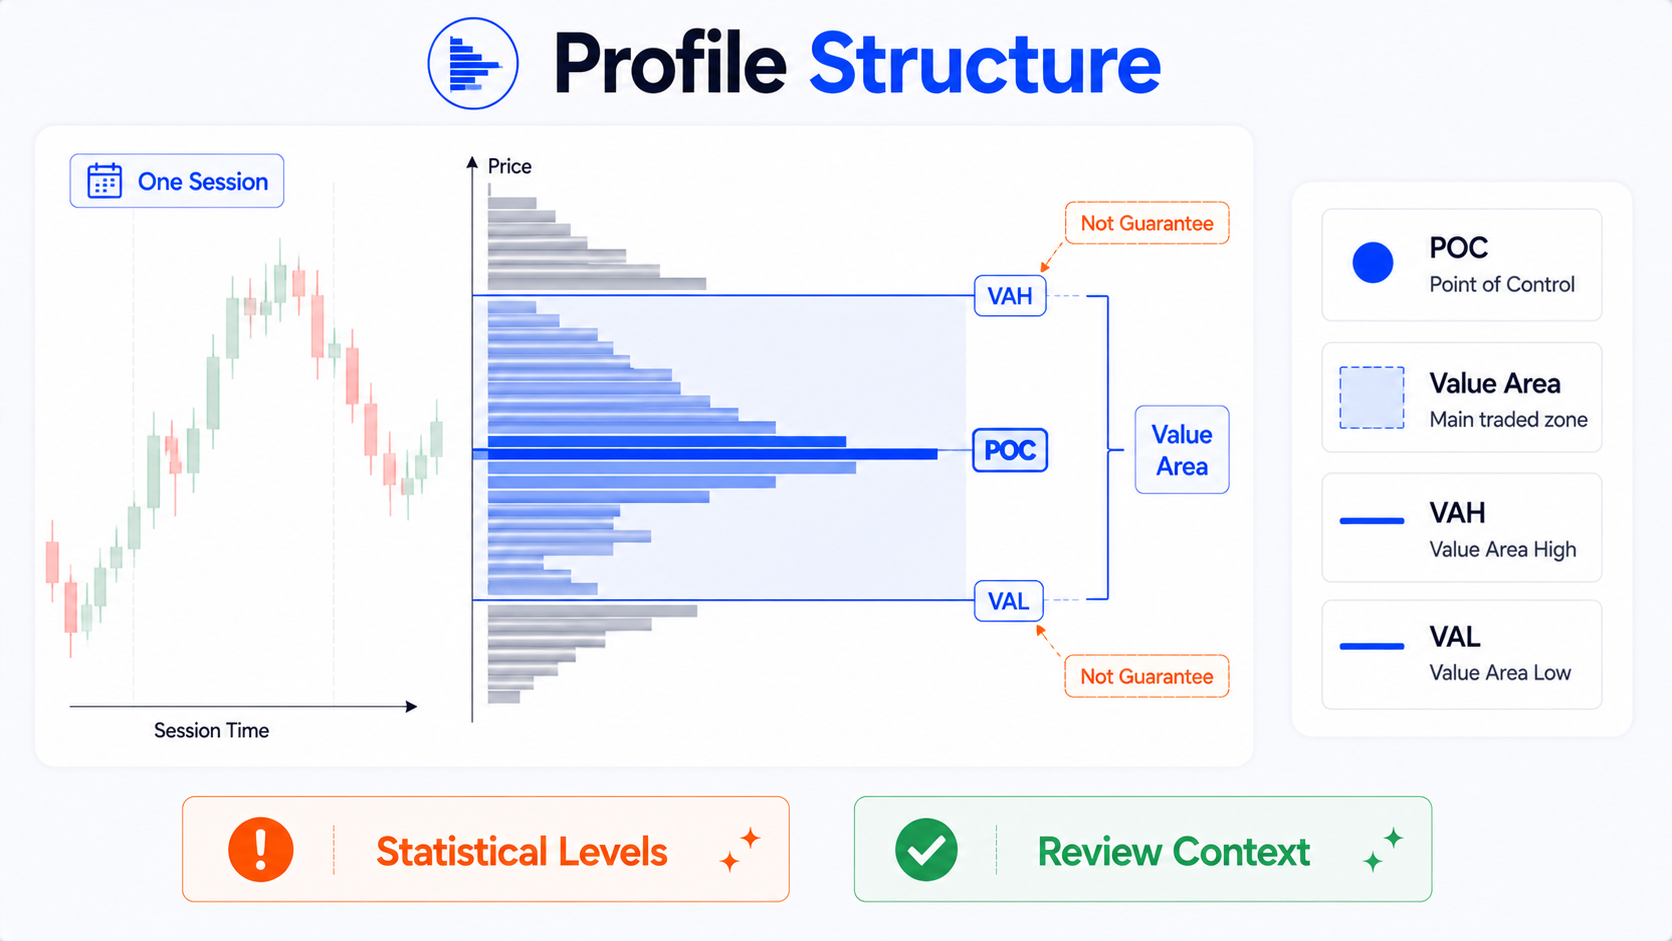
POC stands for Point of Control.
Think of it as:
The price level with the highest volume in a given profile.
If that profile is a day's Session Volume Profile, POC means:
The price zone where the most trading occurred in that session.
It is not "a level the market will definitely defend" or "where price will definitely bounce next."
A better reading:
This is where the most trading happened during that session.
That shows meaningful participation near that price—but how price reacts afterward still depends on trend, news, liquidity, candle structure, and market conditions.
How can you observe POC?
You can watch:
- Whether the day's POC sits in the middle of the session;
- Whether POC is near the session high or low;
- Whether POC shifts up or down over time;
- Whether volume behavior changes when price returns near POC;
- Whether POC across multiple sessions trends higher or lower;
- Whether POC overlaps with other structural levels.
But do not write things like:
- Buy when price reaches POC;
- POC is always support;
- Once POC breaks, price must continue.
Those statements are too absolute.
What are Value Area, VAH, and VAL?
Value Area can be understood as:
The price zone that contains most of the volume in a profile.
Many Volume Profile tools use a default ratio—often 70%—to define the price range where most volume occurred. That range is the Value Area.
What is VAH?
VAH stands for Value Area High.
In plain terms:
The upper boundary of the Value Area—the top edge of the main trading zone.
What is VAL?
VAL stands for Value Area Low.
In plain terms:
The lower boundary of the Value Area—the bottom edge of the main trading zone.
How do the three fit together?
Think of it this way:
- POC: the price with the most volume in that session;
- Value Area: the price range where most volume occurred;
- VAH: the upper edge of that range;
- VAL: the lower edge of that range.
Together they tell you:
Most trading in this session concentrated in this zone, with one price seeing the most volume.
They do not tell you:
What price will definitely do the next time it reaches those levels.
Why VAH and VAL are not automatic breakout levels
Many beginners immediately treat VAH and VAL as fixed support and resistance:
- Price breaks above VAH—go long;
- Price breaks below VAL—go short;
- Price returns to VAH—expect a reaction;
- Price returns to VAL—expect a reaction.
The problem is that VAH and VAL are statistical boundaries—not market commands.
They can serve as observation points because they mark the edges of a session's main trading zone.
But how price behaves there depends on context.
For example:
- Is today a trending day?
- Is there a news event?
- Is it near the open or close?
- Is volume expanding?
- Are candles slicing through quickly?
- Is it just low-liquidity noise?
- Does the current session structure match the previous one?
The same VAH can behave very differently in different environments.
How do you add Session Volume Profile on TradingView?
Steps may vary slightly by interface version, but the general flow is:
- Open a chart on the TradingView website;
- Click Indicators in the top toolbar;
- In the search box, type:
- Session Volume Profile; or
- Volume Profile;
- Find TradingView's built-in Session Volume Profile;
- Click to add it to the chart;
- View the horizontal volume distribution for each session;
- Open indicator settings to adjust style, session, POC, VAH, VAL, and related options.
If your account permissions, market data, or chart interval do not support certain displays, available options may differ. When that happens, check:
- Whether your chart interval is supported;
- Whether you have data for that market;
- Whether you added the built-in indicator;
- Whether some display items are hidden;
- Whether related lines are turned off in settings.
What can you adjust in SVP settings?
Session Volume Profile settings usually fall into these groups:
1. Session
This is the core of SVP.
You can observe different sessions, such as:
- Regular session;
- Extended session;
- Pre-market;
- Post-market;
- Futures session;
- Custom session.
Trading hours differ by market.
For US stocks, futures, forex, or crypto, session meaning varies.
Beginners should confirm first:
Which session is the current profile counting?
Otherwise you may mix pre-market, regular hours, and after-hours volume and misread the profile.
2. POC display
You can turn the POC line on or off and adjust:
- Color;
- Line style;
- Thickness;
- Whether it extends;
- Whether a label shows.
Beginners should keep POC visible—but not make it too thick or bright.
It is an observation line, not a command line.
3. VAH / VAL display
VAH and VAL can usually be toggled separately.
You can adjust:
- Color;
- Line style;
- Display mode;
- Whether lines extend to the right;
- Label style.
Consider making VAH and VAL more subdued than POC so three lines do not dominate the chart.
4. Value Area percentage
Value Area represents where most volume in the profile occurred. Many users rely on common defaults, but different settings shift VAH and VAL.
Beginners should know:
Value Area is not a fixed natural range—it depends on your parameters.
If you change Value Area Volume, VAH and VAL positions may move too.
5. Up / Down or Total Volume display
Some settings let you choose:
- Total volume;
- Up volume / down volume;
- Delta or difference display.
Beginners should start simple—understand volume by price first, then explore color splits.
6. Profile width and placement
If the horizontal profile is too wide, it blocks candles; too narrow, and it is hard to read.
You can adjust:
- Profile width;
- Opacity;
- Left/right placement;
- Whether it overlays price;
- Left vs right side display;
- Bar colors.
The goal:
See the distribution without hiding price structure.
Scenarios where SVP is useful to observe
Scenario 1: Intraday review
This is the best starting point for beginners.
After the close, you can review:
- Where the day's POC was;
- Which price range the Value Area covered;
- Whether price mostly stayed inside the Value Area or clearly left it;
- Whether the volume center shifted up or down;
- Whether the second half of the session broke away from the main trading zone;
- Whether the day was one-directional, range-bound, or range-then-breakout.
This kind of review is steadier than rushing to trade from SVP.
Use it for review first—before using it for entries.
Scenario 2: Pre-market, regular hours, and after-hours comparison
For markets like US equities, pre-market, regular hours, and after-hours differ sharply in activity and liquidity.
You can observe:
- Where pre-market volume concentrated;
- Whether regular hours accepted the pre-market zone at the open;
- Whether regular-hours POC shifted quickly;
- Whether after-hours volume clustered near news events;
- Whether structure carried across sessions.
But note: pre-market and after-hours liquidity can be thin, so price may move more easily on smaller volume.
Scenario 3: Futures or US equities during the session
For intraday traders or chart reviewers, SVP helps you understand:
- The current session's volume center;
- The previous session's POC, VAH, and VAL;
- Whether price is trading inside the main zone;
- Whether volume is migrating noticeably;
- Whether current movement has left the prior session's value area.
Even during the session, do not stare only at the POC line.
Also watch:
- Open structure;
- Trend direction;
- Volume changes;
- News events;
- Higher-timeframe context;
- Liquidity.
Scenario 4: Range-bound volume structure
SVP is well suited to observing where volume concentrated during range days.
When price chops up and down, ordinary candles show movement—but SVP can show:
- Volume mainly in the middle of the range;
- Thin volume above or below;
- POC near the range center;
- A wide or narrow Value Area;
- Overlapping value areas across multiple sessions.
But whether the range continues cannot be decided from SVP alone.
Common beginner mistakes
Mistake 1: Treating POC as absolute support
POC is where the most volume traded—not a promise the market will hold a level.
Price may react near POC—or slice through.
Consider whether price is trending, mean-reverting, or event-driven.
Mistake 2: Treating VAH / VAL as fixed breakout points
VAH and VAL are Value Area boundaries—not guaranteed breakout signals.
Whether a break continues depends on volume, candle structure, trend, and events.
Mistake 3: Ignoring which session you are viewing
SVP's meaning rests on the session.
If you do not know whether the profile covers pre-market, regular hours, after-hours, or the full day, you will misread it.
Especially for US stocks and futures, session quality and liquidity differ a lot.
Mistake 4: Ignoring data source
Volume Profile depends on volume data.
Different markets, exchanges, and feeds can produce different volume quality and scope.
Different data sources can yield different profiles.
Beginners should confirm:
- Is the symbol correct?
- Is the exchange correct?
- Do you have real-time data?
- Are extended hours included?
- Does the session setting match what you are studying?
Mistake 5: Ignoring news and candle structure
No volume distribution replaces market context.
Earnings, macro data, breaking news, rate decisions, gap opens, and liquidity shifts can push price through so-called key lines quickly.
Do not let POC, VAH, and VAL become excuses to ignore what is actually happening.
A more reasonable SVP workflow
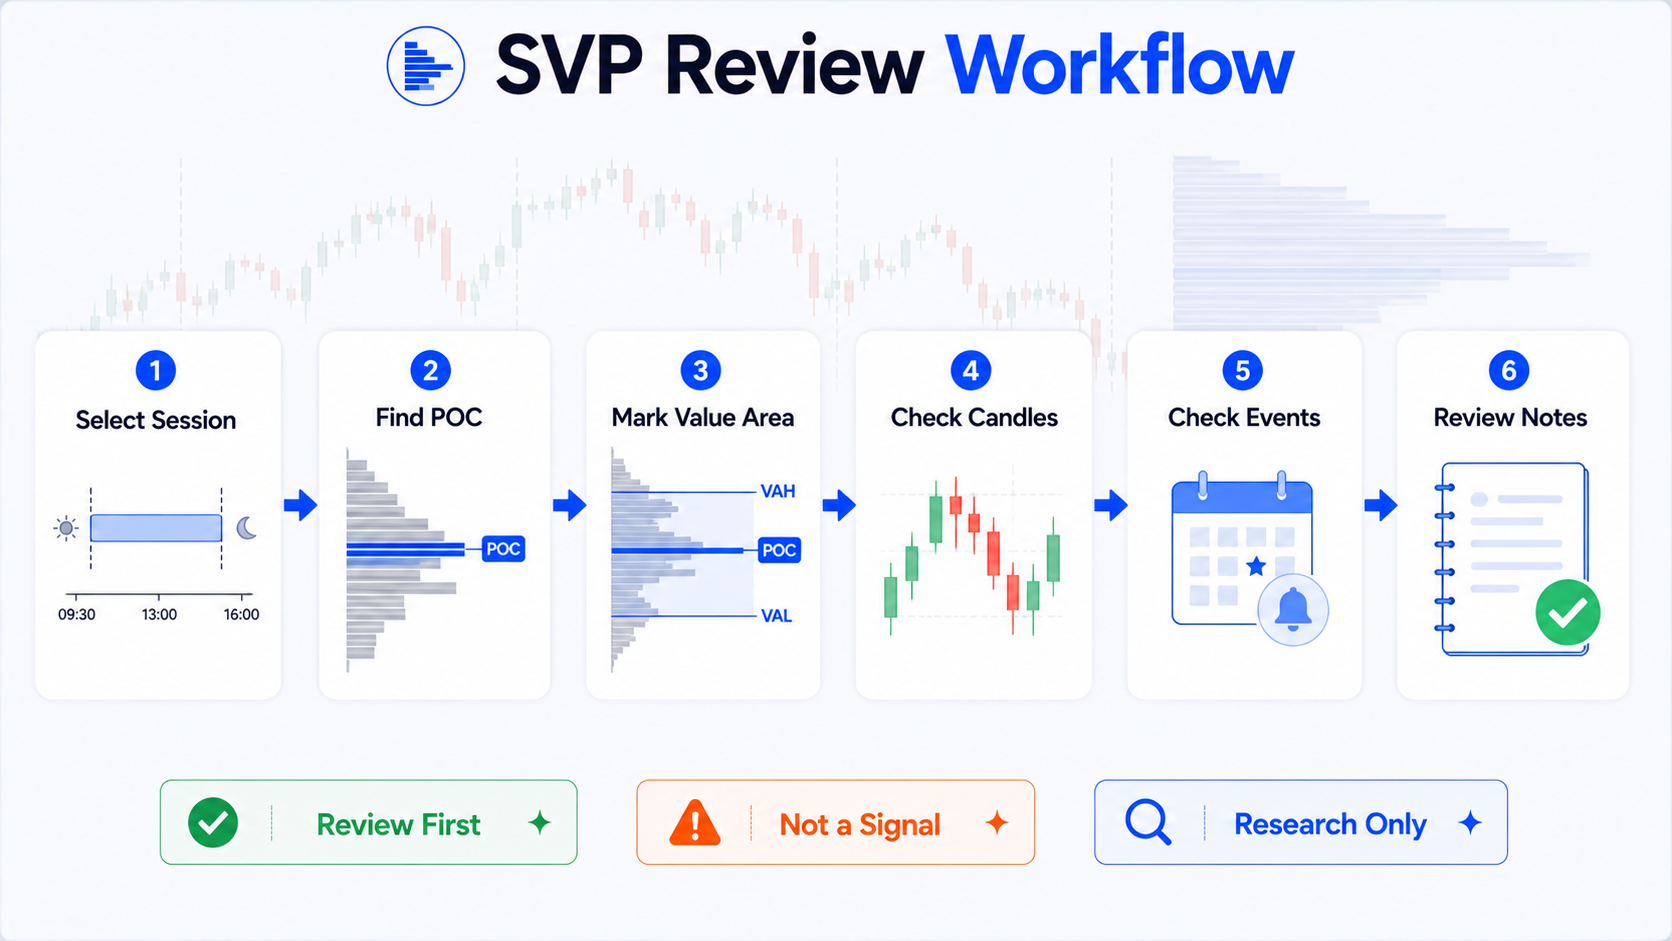
Step 1: Confirm the session
First confirm which session you are viewing:
- Regular trading hours;
- Pre-market;
- After-hours;
- Overnight session;
- Futures session;
- Custom session.
If you do not know the session, do not rush to interpret POC.
Step 2: Observe the concentration zone
Look at where the horizontal profile bars are strongest:
- Is volume concentrated or scattered?
- Is POC in the upper, middle, or lower part of the range?
- Is the Value Area narrow or wide?
- Are there multiple dense zones in one day?
Observe first—do not rush to conclusions.
Step 3: Combine with candle structure
Then see how price moved:
- One-way up;
- One-way down;
- Sideways chop;
- Fast pullback after the open;
- Break then fade;
- Or trading back and forth around POC.
SVP tells you where volume concentrated; candles tell you how price moved.
Step 4: Combine with trend and events
Check:
- Higher-timeframe trend;
- Today's news;
- Earnings;
- Economic data;
- Gap at the open;
- Unusual volume;
- Overall market environment.
Do not read the profile in isolation.
Step 5: Treat key lines as observation points
POC, VAH, and VAL can be observation points.
Better phrasing:
- "When price returns near POC, watch volume and candle reaction."
- "VAH / VAL mark the prior session's value area boundaries—useful for review."
- "This session's volume center shifted—worth noting."
Avoid writing:
- "Buy at POC."
- "Breaking VAH guarantees upside."
- "Breaking VAL guarantees downside."
Step 6: Validate through review
The best way to learn is to review after the close:
- Did POC matter that day?
- Did price chop around the Value Area repeatedly?
- When did VAH / VAL matter—and when did they not?
- Do event days behave differently from normal days?
- Does SVP look different across assets?
With enough review, you learn when these lines are useful—and when they are just lines on a chart.
A beginner review log template
- Date observed:
- Asset:
- Data source:
- Trading session:
- Pre-market / after-hours included?
- POC location:
- VAH / VAL range:
- Was the Value Area concentrated?
- Did price stay mostly inside or outside the Value Area?
- Day's candle structure:
- News / earnings / economic data?
- Actual reaction near POC / VAH / VAL:
- Review takeaway:
- Reminder: POC, VAH, and VAL are statistical references—not trade signals.
The point of this template is not to predict the next move—it is to train your observation skills.
Who is SVP for—and who is it not for?
| User type | Suited to SVP? | Why |
|---|---|---|
| Intraday reviewers | Yes | See where volume concentrated in each session |
| Users who already read ordinary volume | Yes | Go deeper into volume by price |
| Researchers comparing pre-market / regular / after-hours | Yes | Compare structure across sessions |
| Users looking only for trade signals | No | SVP is not a signal tool |
| Users unwilling to read candle structure | No | Volume distribution must be read with price action |
| Users treating POC as absolute support/resistance | No | Statistical lines do not guarantee price reaction |
If you treat it as a review tool, SVP is valuable.
If you want it to tell you where to buy and sell, it can easily mislead you.
Display tips for chart screenshots
Session Volume Profile charts get crowded easily. Before screenshots:
- Keep the profile width moderate;
- Avoid harsh colors;
- Let POC stand out slightly more than VAH / VAL;
- Do not make VAH / VAL too thick;
- Keep the background clean;
- Fade grid lines;
- Hide unrelated indicators;
- Confirm no account, order, or private information is visible;
- Use minimal labels—only the lines this article explains.
For tutorial images, show one session or two adjacent sessions—not too many days at once.
The busier the chart, the harder it is for beginners to follow.
Summary: SVP observes session structure—it is not a signal machine
The core value of TradingView Session Volume Profile is helping you see where volume concentrated within a trading session.
It helps you understand:
- This session's volume center;
- Where POC sits;
- Which price range the Value Area covers;
- VAH and VAL boundaries;
- Whether structure changes across sessions;
- Whether price trades around the concentration zone or leaves it.
But it cannot guarantee:
- POC will act as support;
- VAH will act as resistance;
- VAL will bounce;
- Price will continue after breaking a line;
- Using SVP will improve trading results.
POC is not an answer the market wrote for you. It only tells you where the most volume traded in that session.
The most common SVP mistake is treating statistical lines like command lines.
Use it for review first—before rushing to trade from it.
This article covers only the basics of TradingView Session Volume Profile, SVP, POC, VAH, VAL, and intraday volume distribution. It does not provide investment advice, does not present these lines as definite support or resistance, and does not promise any returns.
FAQ
What is TradingView Session Volume Profile?
TradingView Session Volume Profile is a tool that shows volume distribution by trading session. On the chart it displays how much volume occurred at each price level within a session, so you can see where trading was most concentrated.
What does POC mean?
POC stands for Point of Control—the price level with the highest volume in a given Volume Profile. It shows where trading was most concentrated in that session, but it does not mean price will necessarily bounce, stall, or reverse there in the future.
What are VAH and VAL?
VAH (Value Area High) is the upper boundary of the main trading zone; VAL (Value Area Low) is the lower boundary. They come from volume distribution statistics—they are not fixed support or resistance levels and are not guaranteed breakout signals.
How is Session Volume Profile different from ordinary volume?
Ordinary volume bars show how much traded on each candle over time—answering when volume was high. Session Volume Profile groups volume by session and price level—answering which prices saw the most trading within that session.
How should beginners use SVP?
Start with post-session review: confirm which session you are viewing, observe the concentration zone, POC, VAH, and VAL, then record findings alongside candle structure, trend, news, and data source. Do not treat POC, VAH, or VAL as direct buy or sell signals.